Distance-Time Graphs Worksheets, Grades 6-8 (Free Sample + Full Unit)
Download a free distance-time graph worksheet for Grades 6-8 below: one student page with an answer key, ready to print. The full unit is two illustrated lessons, one on speed and distance-time graphs and one on velocity, acceleration and speed-time graphs, with guided notes, graphing tasks, reading checks, two Prove-it data tasks, vocabulary cards and a quiz, for USD 4.50 on TPT. A three-level motion graphs skill ladder for extra practice is sold separately for USD 3.50.
Teaching notesHow to Teach Distance-Time Graphs in Middle School (Grades 6-8)
Free sample worksheet
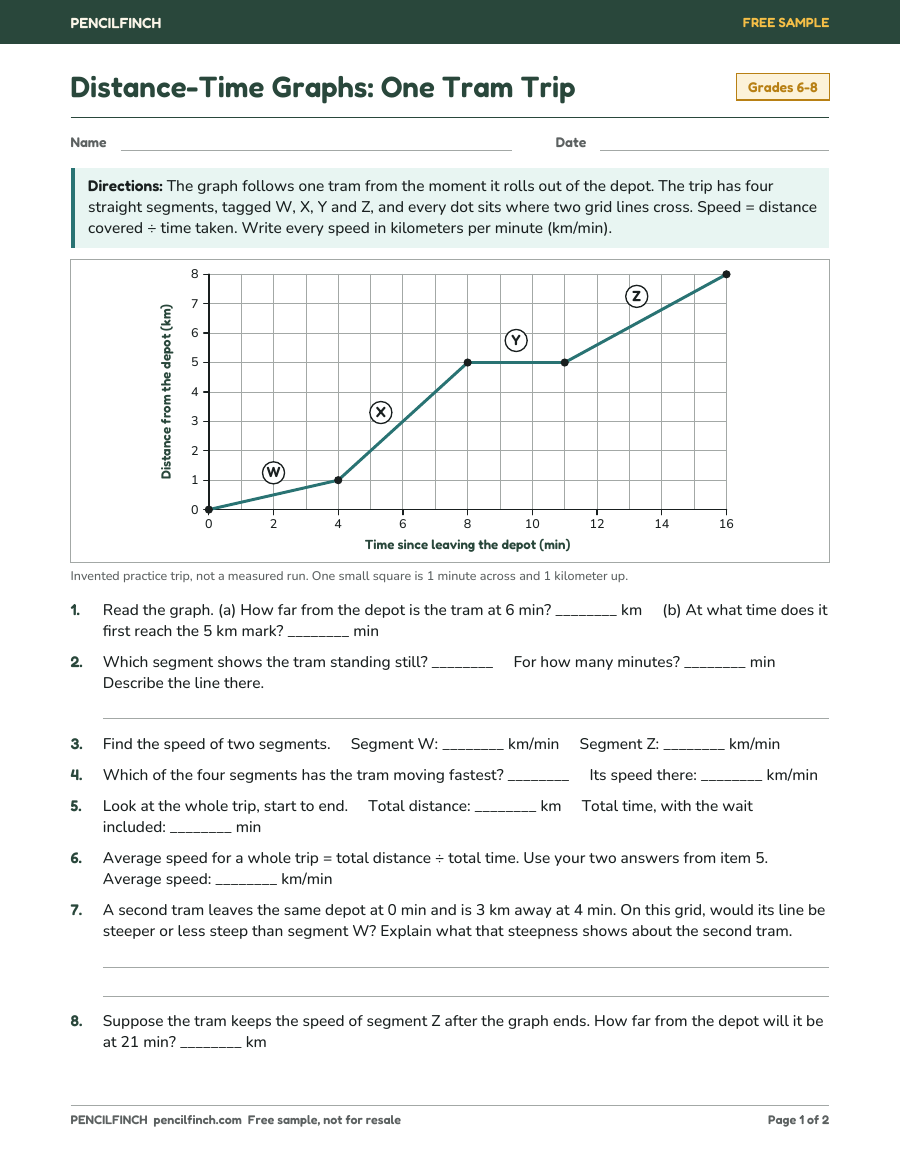 Download the free sample (PDF, 8 items with answer key)
Free to download, no email needed. These problems are not in the paid unit.
What is in the full unit
| Full unit | Speed, Velocity & Acceleration Science | Distance Time Graphs | Grades 6-8 |
|---|---|
| Pages | 30 pages in one PDF |
| Answer key | Included with Rubric |
| Standards | Supports and connects to NGSS MS-PS2-2 and the graphing practice of MS-PS3-1 (not a claim of full alignment) |
| Grades | 6-8 |
| Price on TPT | USD 4.50 |
Get the full unit on TPT (USD 4.50)
- Lesson 1, speed and distance-time graphs: reference point and shared units, distance, speed = distance ÷ time, average and instantaneous speed, motion maps, and distance-time graphs (flat, straight, steeper, curved, sloping down; slope = speed). Students graph a scooter trip and plot real split times to test whether a sprinter runs at one speed.
- Lesson 2, velocity, acceleration and speed-time graphs: velocity as speed with direction (real hurricane advisories), positive and negative directions, distance vs. displacement, acceleration in m/s² (speeding up, slowing down, turning), and speed-time graphs (slope = acceleration). Students graph a train trip and calculate when a sprinter accelerated.
- Two Prove-it data tasks with CER. Real data: laser-measured 10 m split times and section speeds from the 2009 World Championships 100 m final (published in New Studies in Athletics, 2011), NOAA National Hurricane Center advisories and NASA space station facts. Practice graphs are labeled SIMULATED.
- Explanation pages with two scene illustrations drawn in code (no AI image generator), motion maps, distance-time and speed-time graphs and velocity arrows; guided notes, reading checks, two pages of picture vocabulary cards and a 10-question quiz.
- Answer key for every question with scoring rules, completed notes, completed graphs and model CER answers; a two-lesson plan with an optional walking warm-up, misconceptions and data notes for the teacher.
Goes with
-
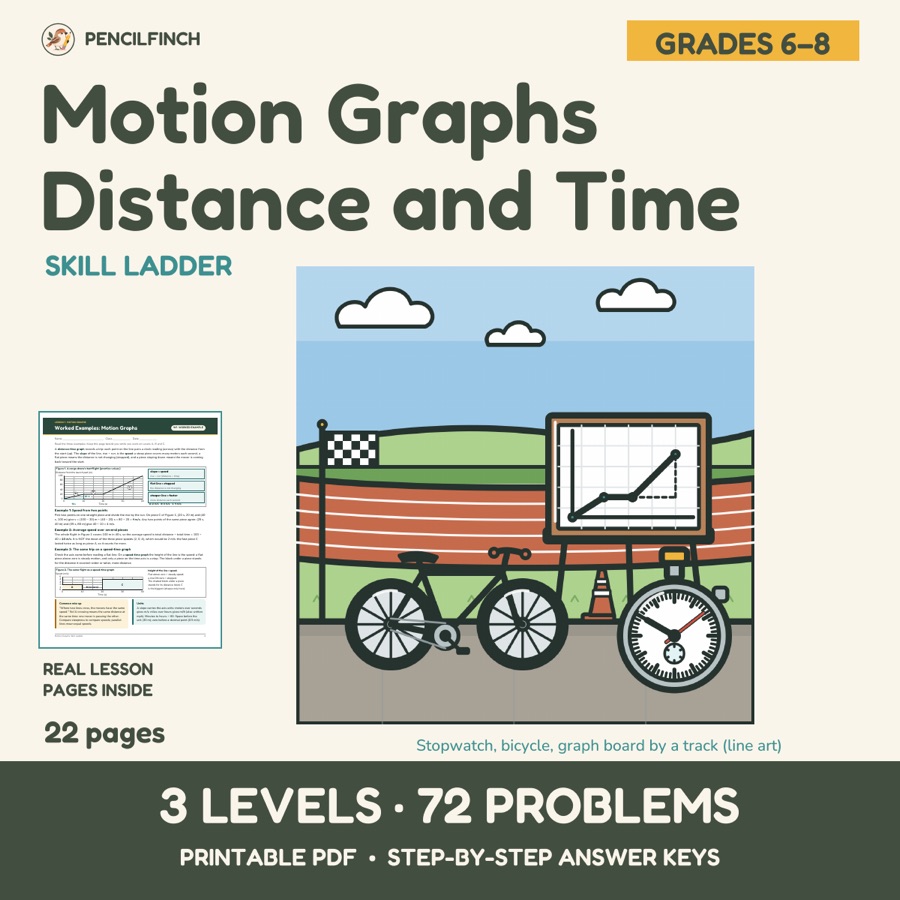
Motion Graphs Skill Ladder | Distance-Time Graph Science Worksheets | Grades 6-8
Companion. 22 pages, grades 6-8, answer key included. USD 3.50
View on TPT
Pages from the unit
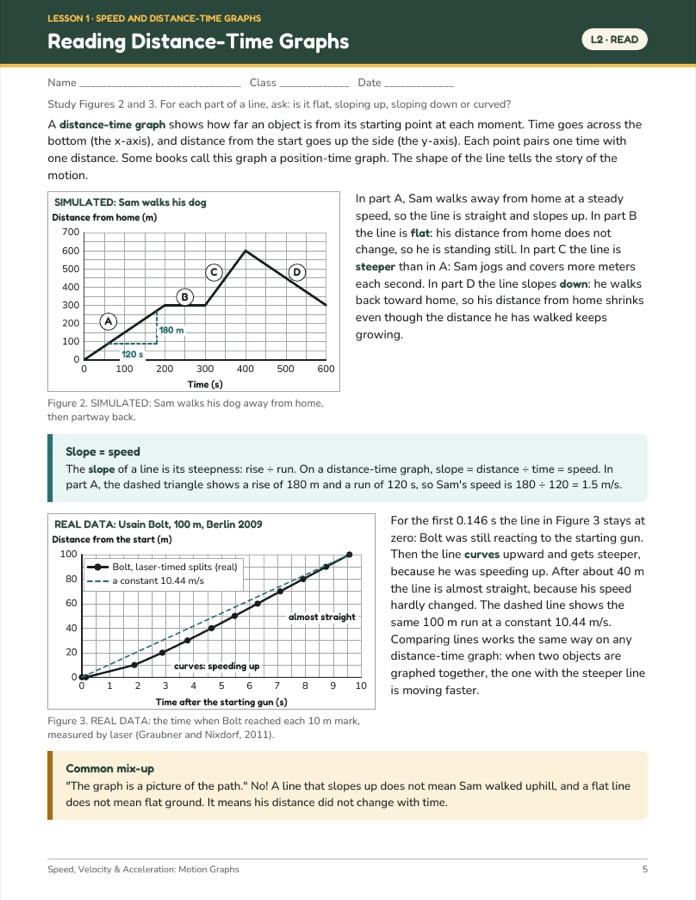
Page 5 of 30 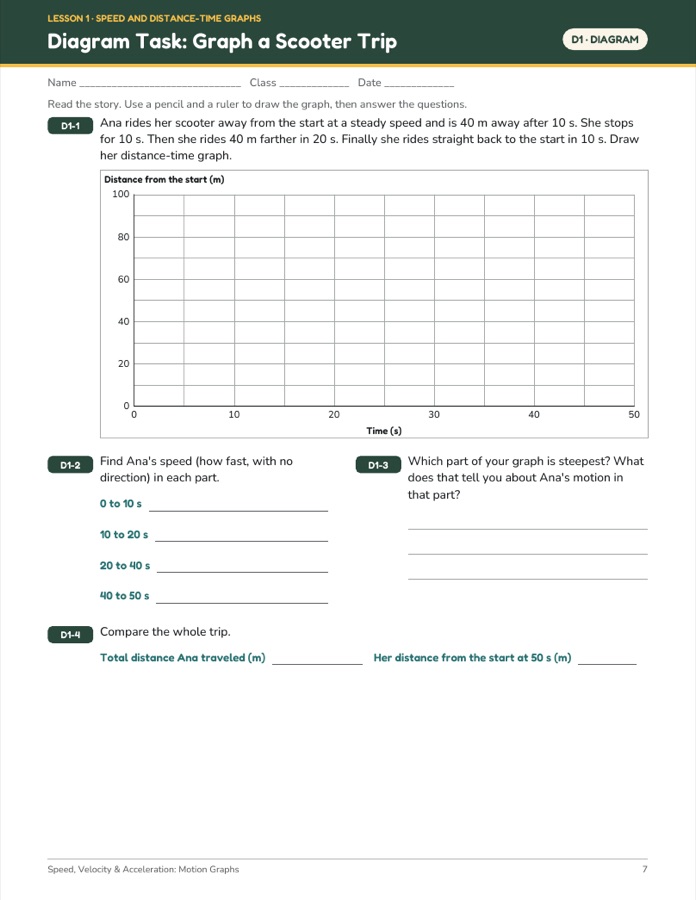
Page 7 of 30 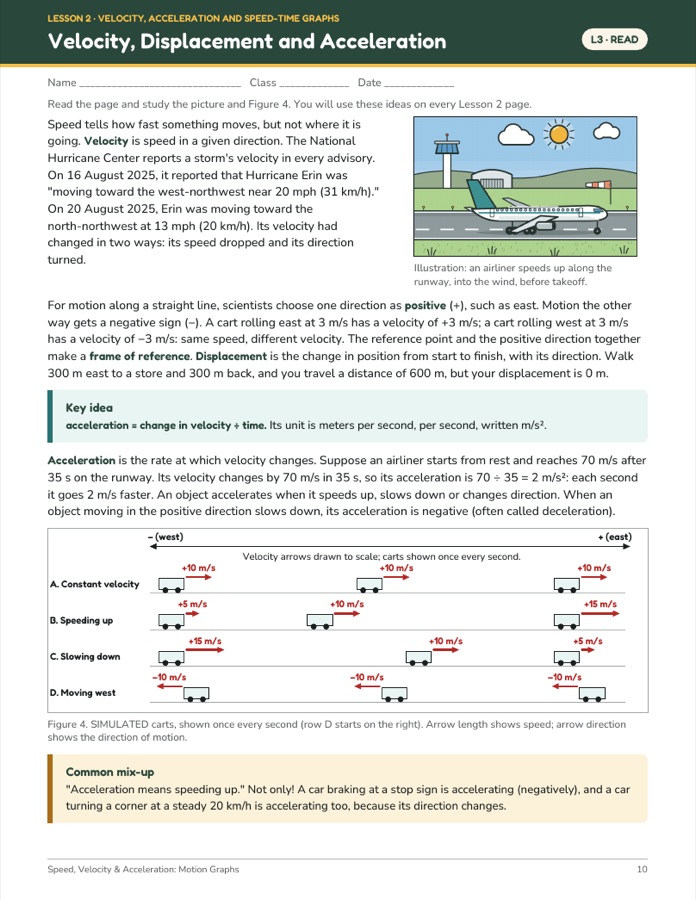
Page 10 of 30
Student pages are designed to print in black and white; all labels, numbers, graphs and arrows are printed text and vector drawings.
How teachers use it
A distance-time graph shows how far an object is from its starting point at each moment, and the slope of its line is the object's speed. Each lesson is planned for about 50 minutes. Students read the explanation pages first, then work the guided notes, the graphing task and the reading check, and finish with a Prove-it data task and a claim-evidence-reasoning write-up.
The free sample on this page is a one-page practice set on distance-time graphs with an answer key. Its items are new and are not in the paid unit, so you can use it as a pre-check or an exit ticket and still teach the full lessons afterward.
Lesson 1 teaches students to read the shape of a line before they calculate: flat means stopped, steeper means faster, sloping down means coming back toward the start. They then find speed as rise ÷ run and compare a simulated walk with the real 100 m record run. Lesson 2 adds direction (velocity and displacement) and acceleration, and reads the same kinds of motion from a speed-time graph. The listed prerequisites are reading a line graph and a table and dividing decimals; a calculator helps.
The unit supports and connects to NGSS MS-PS2-2 (changes in motion, frame of reference and units) and MS-PS3-1 (constructing and interpreting graphical displays of data; speed as distance ÷ time). That is not a claim of full alignment, and forces and kinetic energy are not taught in this pack.
Before and after this topic
In the order used on this site, this page comes after heat transfer and before Newton's third law, so students can describe motion with graphs before they explain it with forces. The skill ladder listed above gives three levels of extra distance-time graph practice.
- Teaching notes for this topicHow to Teach Distance-Time Graphs in Middle School (Grades 6-8)
- Before this topicHeat Transfer Worksheets for Grades 6-8 (Free Sample + Full Unit)
- After this topicNewton's Third Law Worksheets for Grades 6-8 (Free Sample + Full Unit)
- All topics in this lineMiddle School Physical Science Worksheets (Grades 6-8)
Common questions
Is the free worksheet the same as a page from the paid unit?
No. The sample is written separately for this site, and its items are not in the unit. It uses the same page style, so you can see what the student pages look like before you buy.
Is the sprint data real?
Yes. The 10 m split times and section speeds are laser measurements from the 2009 World Championships 100 m final, published in New Studies in Athletics in 2011. The printed practice graphs, such as the dog walk and the city bus trip, are simulated and are labeled SIMULATED. The scooter and train trips that students graph themselves are made-up stories with round numbers.
What is the difference between the unit and the skill ladder?
The unit teaches the concepts in two lessons. The skill ladder is practice only: one page of worked examples, then three levels of distance-time graph problems (read the graph, average speed over segments, real contexts) with self-check strips, so students can work at different levels at the same time. It uses all-new graphs and numbers.