How to Teach Distance-Time Graphs in Middle School (Grades 6-8)
By the end of this topic, students should be able to look at a distance-time graph and say when the object moved, when it stood still and how fast it went. Most of them can plot the points; the trouble starts when they read the finished line as a drawing of the ground. This note gives you the idea, one graph with exact numbers, three wrong ideas with replies, a board lesson and three check questions.
Printable for this topic: Distance-Time Graphs Worksheets, Grades 6-8 (Free Sample + Full Unit) (free sample page and the full unit).
The idea in plain words
A distance-time graph is a record of where a moving object was at each clock reading: time runs along the bottom, distance from one fixed point runs up the side, and the steepness of the line tells the speed.
Speed comes from two points, never from one. On a straight segment, take two dots, subtract their distances (the rise) and their times (the run), then divide. That slope is the speed.
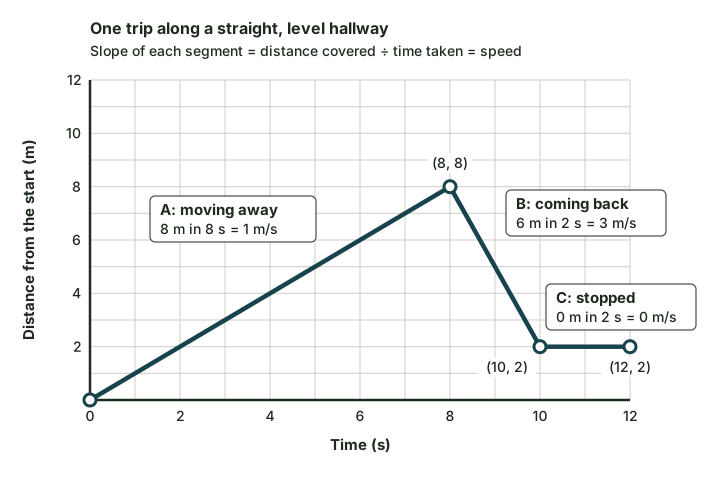
In the graph, segment A runs from (0, 0) to (8, 8): 8 m in 8 s, so 1 m/s. Segment B runs from (8, 8) to (10, 2): 6 m back in 2 s, so 3 m/s, three times as steep as A and three times as fast. Segment C runs from (10, 2) to (12, 2): the clock moves on for 2 s while the distance reading does not change, so the speed is 0. The line always moves to the right, because time only goes forward. A line standing straight up would put the object in many places at one instant.
Three misconceptions and what to say
"The line goes up, so it is climbing a hill."
Researchers call this reading the graph as a picture: students expect the line to look like the scene, as most drawings they meet in school do. Ask: "What is measured along the bottom?" Seconds, not meters of ground. Then have a student describe a walk along a level hallway that produces segments A, B and C.
"A flat line means it keeps going at a steady speed."
Flat sounds like "steady", and students often read how high the line is when they should read how steep it is. Have them read both ends of segment C aloud: 2 m at 10 s, 2 m at 12 s. Ask: "How far did it travel in those 2 seconds?" Zero meters in 2 seconds is 0 m/s. Steady motion is a straight line that slopes. (Flat does mean steady when the side axis is speed, which is why the axis label gets read first.)
"If the line goes down, it is going downhill, or slowing down."
Students carry over the picture idea, or they link "down" with "less speed". Here the side axis is distance from the start, so falling segment B means that distance is shrinking: the object is coming back. How steeply it falls still gives the speed. Say: "Down means closer to where it began. Steep means fast, in either direction."
A 10-minute mini-lesson
- (1 minute) Draw two axes on the board. Label the bottom "time (s)", 0 to 10. Label the side "distance from the door (m)", 0 to 12. Ask: "If I put one dot on this grid, which two facts does it tell you?"
- (2 minutes) Tell the story: a student is 12 m from the classroom door and walks toward it; 4 s later she is 4 m away. Plot (0, 12) and (4, 4) and join them. Ask: "How far each second?" Write 8 ÷ 4 = 2 m/s beside the segment.
- (2 minutes) "She stops to tie a shoe for 2 seconds." Ask: "Where does the next dot go?" Take votes between (6, 4) and (4, 2), then plot (6, 4). Ask: "Why can the line not go straight down here?"
- (2 minutes) "She turns and hurries away: 10 m from the door at 8 s." Plot (8, 10). Ask: "Faster or slower than at first? How can you tell before you calculate?" Then check: 6 ÷ 2 = 3 m/s.
- (2 minutes) "She slows and is 12 m from the door at 10 s." Students plot the last point on paper and find the speed: 2 m in 2 s is 1 m/s. Ask: "Which segment slopes down, and why? Which is fastest?"
- (1 minute) Exit question: "The hallway was level the whole time. So what does the height of the line show?"
Quick check
- One dot sits at (4 s, 10 m). A student says the speed is 2.5 m/s. What did she assume?
- A student's graph has a line that goes straight up from (5 s, 10 m) to (5 s, 30 m). Explain why no real object can do this.
- A dog runs 30 m away from its owner in 10 s, then runs straight back in 6 s. Describe the two segments of its distance-time graph and say which is steeper.
Answers: 1. A start at (0 s, 0 m) and one steady speed. 2. It would cover 20 m in no time at all. 3. Up from 0 m to 30 m at 3 m/s, then down from 30 m to 0 m at 5 m/s. The second is steeper: an equal distance in fewer seconds.
Sources
- OpenStax, Physics, section 2.3 "Position vs. Time Graphs": https://openstax.org/books/physics/pages/2-3-position-vs-time-graphs
- OpenStax, College Physics 2e, section 2.8 "Graphical Analysis of One-Dimensional Motion": https://openstax.org/books/college-physics-2e/pages/2-8-graphical-analysis-of-one-dimensional-motion
- L. D. Murphy, University of Illinois (MSTE), "Graphing Misinterpretations and Microcomputer-Based Laboratory Instruction, with Emphasis on Kinematics": https://mste.illinois.edu/murphy/Papers/GraphInterpPaper.html
The full unit
Speed, Velocity & Acceleration Science | Distance Time Graphs | Grades 6-8
30 pages, grades 6-8, answer key included with rubric. USD 4.50
Get the full unit on TPT (USD 4.50)
Next topics
- Before this topicHeat Transfer Worksheets for Grades 6-8 (Free Sample + Full Unit)
- After this topicNewton's Third Law Worksheets for Grades 6-8 (Free Sample + Full Unit)
- All topics in this lineMiddle School Physical Science Worksheets (Grades 6-8)