Natural Resources Worksheets for Grades 6-8 (Free Sample + Full Unit)
Download a free natural resources worksheet for Grades 6-8 below: one student page on renewable and nonrenewable resources with an answer key, ready to print. The full unit is two illustrated lessons, one on renewable and nonrenewable resources and where they form and one on population, consumption and impacts, with guided notes, a drilling diagram task, an area-model task, reading checks, two Prove-it data tasks with CER, vocabulary cards and a quiz, for USD 4.50 on TPT.
Free sample worksheet
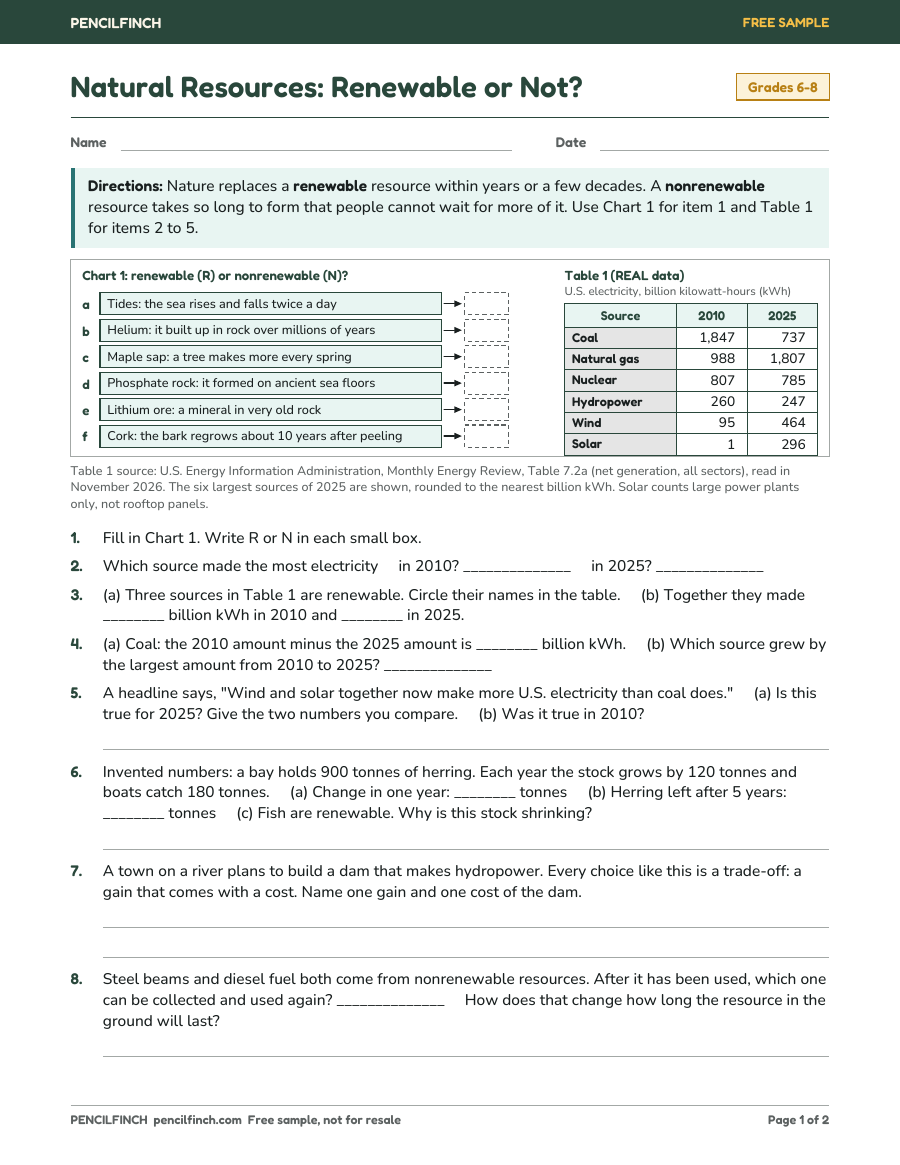 Download the free sample (PDF, 8 items with answer key)
Free to download, no email needed. These problems are not in the paid unit.
What is in the full unit
| Full unit | Natural Resources Science Lessons | Renewable and Nonrenewable | Grades 6-8 |
|---|---|
| Pages | 29 pages in one PDF |
| Answer key | Included with Rubric |
| Standards | Supports and connects to NGSS MS-ESS3-1 and MS-ESS3-4 (not a claim of full alignment) |
| Grades | 6-8 |
| Price on TPT | USD 4.50 |
Get the full unit on TPT (USD 4.50)
- Lesson 1, renewable and nonrenewable resources and where they form: students compare how fast nature replaces a resource with how fast people use it, then explain why oil collects in traps under cap rock, why most copper ore forms above subduction zones (Chile and Peru), and how the High Plains aquifer formed and is recharged. They use real USGS copper data and EIA oil data to show uneven distribution.
- Lesson 2, population, consumption and impacts: total consumption = population × per-capita consumption, shown with an area model. Students read real USGS water-level data for the High Plains aquifer and NASA facts about an open-pit copper mine, model a simulated town's water use, and use U.S. Census and EIA data (1950 to 2020) to test the claim that more people always means more total energy use.
- Two Prove-it data tasks with CER. Real data come from the USGS, EIA, U.S. Census Bureau, United Nations and NASA; the drilling region, the two farms and the towns are simulated and labeled that way.
- Explanation pages with two scene illustrations drawn in code (no AI image generator), an oil-trap cross-section, a subduction-zone cross-section, a tank model, an area model and a real aquifer chart; guided notes, reading checks, two pages of picture vocabulary cards (16 words) and a 10-question quiz.
- Answer key for every question with scoring rules, completed notes, the shaded oil trap, bar chart, area models and model CER answers; a two-lesson plan with an optional aquifer-in-a-cup demo, misconceptions and printing notes for the teacher.
Pages from the unit
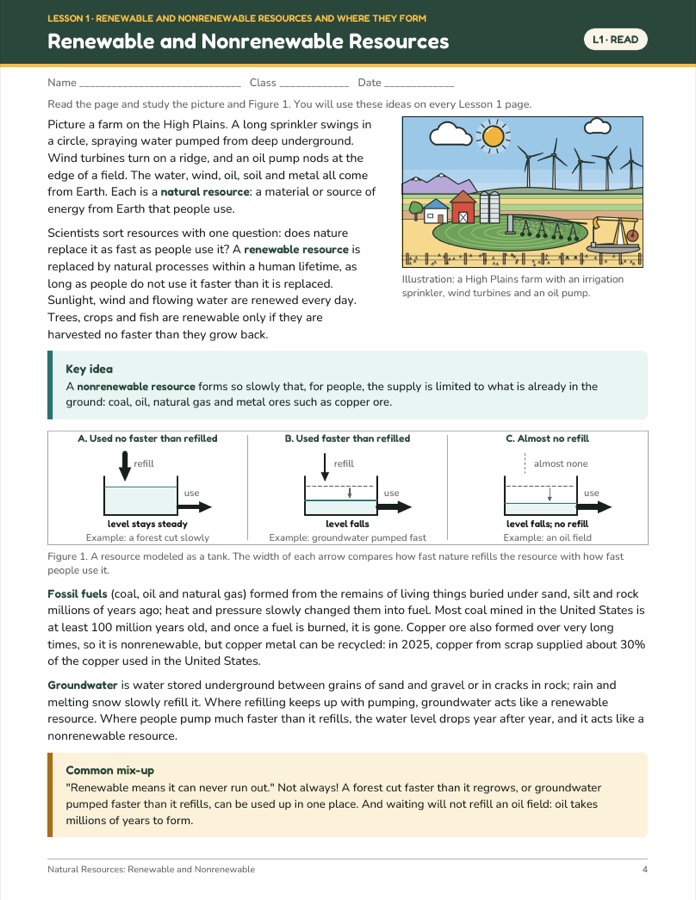
Page 4 of 29 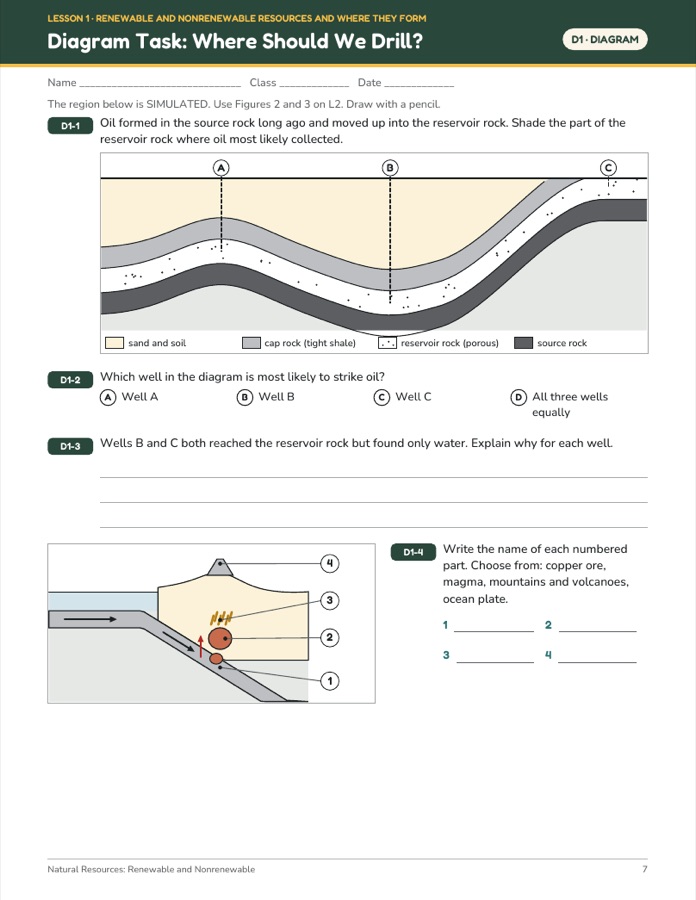
Page 7 of 29 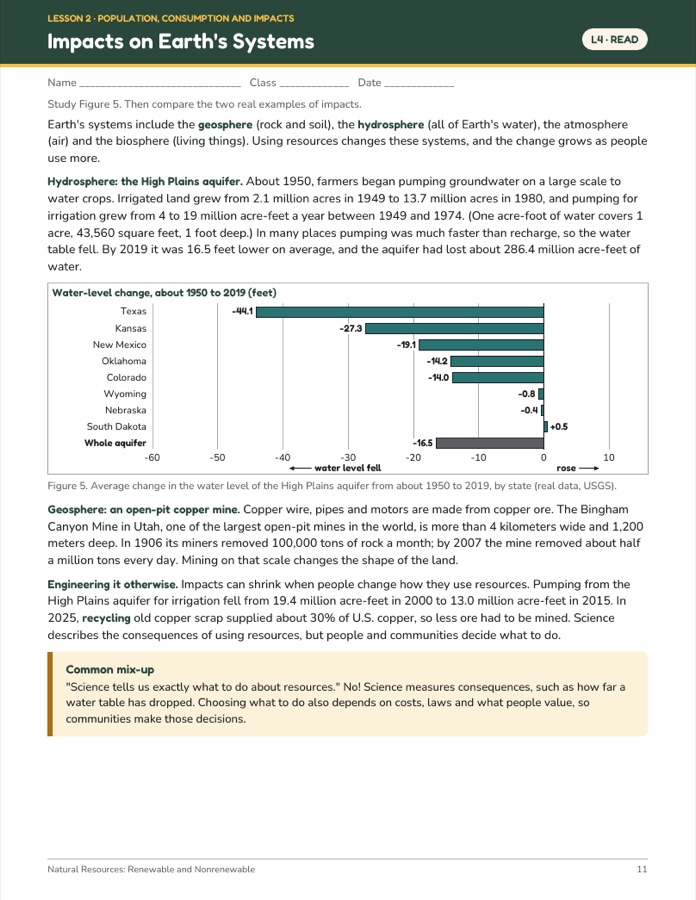
Page 11 of 29
Student pages are designed to work in black and white; all labels, numbers, graphs and arrows are printed text and vector drawings.
How teachers use it
A renewable resource is one that natural processes replace within a human lifetime, as long as people do not use it faster than it is replaced; a nonrenewable resource forms so slowly that the supply is limited to what is already in the ground. Each lesson is planned for about 50 minutes. Students read the explanation pages first, then work the guided notes, the diagram or area-model task and the reading check, and finish with a Prove-it data task and a claim-evidence-reasoning write-up.
The free sample on this page is a one-page practice set on renewable and nonrenewable resources with an answer key. Its items are new and are not in the paid unit, so it can serve as a quick check before the unit or a review after it without repeating anything students will see in the lessons.
The unit goes past sorting resources into two lists. Lesson 1 models a resource as a tank that is refilled and used at different rates, which is why groundwater can act like a renewable resource in one place and a nonrenewable one in another. It then ties each resource to the geology that put it there: oil under cap rock, copper ore above subduction zones, water in an aquifer. Lesson 2 separates two things that both raise total use, more people and more use per person, and has students check a claim against 70 years of U.S. data.
The listed prerequisites are reading a bar chart and a data table, multiplying and dividing, and finding a percent. The unit supports and connects to NGSS MS-ESS3-1 (uneven distributions of mineral, energy and groundwater resources from geoscience processes) and MS-ESS3-4 (population and per-capita consumption impact Earth's systems). That is not a claim of full alignment.
Before and after this topic
In the order used on this site, this page comes after the geologic time scale, since fossil fuels and copper ore formed over very long times, and before moon phases, where the site moves from Earth to space.
- Before this topicGeologic Time Scale Worksheets, Grades 6-8 (Free Sample + Full Unit)
- After this topicMoon Phases Worksheets for Grades 6-8 (Free Sample + Full Unit)
- All topics in this lineMiddle School Earth and Space Science Worksheets (Grades 6-8)
Common questions
Is the free worksheet the same as a page from the paid unit?
No. The sample is written separately for this site, and its items are not in the unit. It uses the same page style, so you can see what the student pages look like before you buy.
Is the data in the unit real?
Most of it. The copper, oil, aquifer, population and energy figures are real data from the USGS, EIA, U.S. Census Bureau, United Nations and NASA. The drilling region, the two farms and the towns are simulated and are labeled that way on the pages.
Do students need to know plate tectonics first?
It helps, but it is not required. The listing says plate tectonics basics help and are reviewed in the pages; a subduction-zone cross-section on the explanation page shows one plate sinking under another and magma rising above it.